Oil and Gas Leases: The Hidden Duty to Develop – A Texas Gulf Coast Example
Case Summary
One of the first things an oil and gas company must do before they can drill a well is to obtain the mineral rights for the land they want to drill on. The most common way to do this is to lease the mineral rights to the land. These leases come with certain unwritten legal or hidden obligations, known in the legal world as “implied covenants.”
Oil and gas leases contain several implied covenants. One of them is known as the “Duty to Develop.” This refers to the obligation of an Oil and Gas Company (the lessee) to make reasonable efforts to explore and develop an oil and gas lease. Whether or not an oil and gas company has lived up to its obligation to develop a lease responsibly may become a matter of dispute and sometimes ends up in the courts.
Understanding the subsurface geology is often critical in determining whether a company has met its obligations. The question often comes down to whether a company can profit from additional drilling or other development activities. Answering this question is, at least in part, frequently dependent upon the potential quantity of oil and/or gas in the subsurface. These questions require the expertise of geologists and often additional subsurface professionals such as geophysicists, petrophysicists, reservoir engineers, and others.
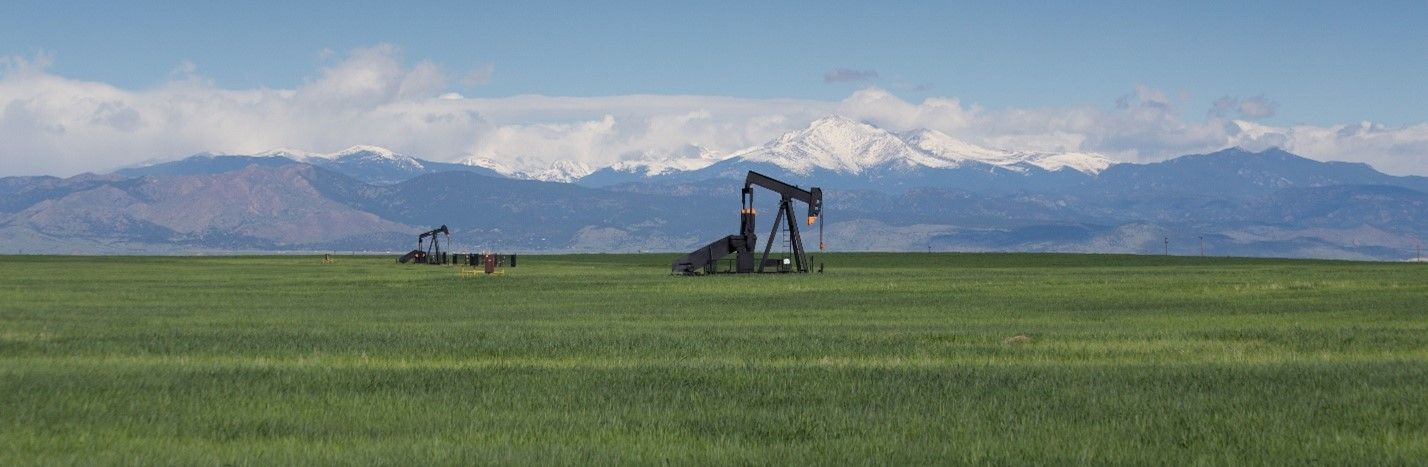
The following provides an example in which an operator was found to have breached their obligations to make reasonable efforts to explore and develop oil and gas in a lease and the role geology played in the case. The case went to court in the 1980s, but its origins can be traced back to the 1930s when a major oil and gas company leased a 10,000-acre tract of land along the onshore Texas Gulf Coast.
The company used seismic reflection technology to explore for oil and gas on the lease. The use of seismic reflection data in oil and gas exploration is common and standard operating procedure today, but in the 1930’s, it was leading-edge technology. The use of seismic enabled the discovery of oil and gas in a sandstone layer in a rock unit called the Frio Formation. The discovery was made in the early 1940s.
Over the next decade, the company found three more oil and gas-bearing sandstone layers in the Frio Formation. By the time the case went to trial, the company had drilled 64 wells and acquired an additional 13 seismic surveys. The field covered an area of over 1,100 acres. It had produced over 100 million barrels of oil, over 100 billion cubic feet of gas, and over 50,000 barrels of condensate, with royalties providing an average income of $10,000 per day. At the time of the trial, 37 wells were still producing.
However, the remaining 8,900 acres of the 10,000-acre remained unexplored and undeveloped. Fields along the Texas Gulf Coast were also known to produce hydrocarbons from slightly deeper and older sandstones in the Vicksburg Formation. The case hinged on the question of whether the operator had fulfilled its obligation to explore the remaining 8,900 acres and test the potential of the Vicksburg Formation.
Expert Analysis
The Operator claimed there was only one structure and one formation with sufficient porosity and permeability to trap and produce hydrocarbons. The landowner (the lessor) challenged this claim and hired a geologist to review the subsurface data.
The geologist for the lessor reviewed the data across the field and concluded that the remaining 8,900 acres of land could contain additional oil and gas accumulations. They also concluded that oil could be present not only in sandstones of the Frio Formation but also in a deeper formation called the Vicksburg.
The jury was tasked with determining whether the Oil and Gas Company had acted reasonably in exploring and developing the lease. The answer to this question required the jury to learn about the geology in the area, how the oil and gas became trapped in the rocks, and the tools used by geologists and geophysics to understand the subsurface.
The subsurface along the Texas Gulf Coast is dominated by sandstones and shales deposited by ancient rivers and in deltas, beaches, barrier islands, and marshes. The sandstones form porous and permeable layers that can both store oil and gas and through which oil and gas can move or migrate. These layers are often called reservoir rocks. Shales form impermeable layers through which oil and gas cannot move, often called seals.
Oil fields are formed when reservoir rocks, seals, and subsurface structures combine in such a way as to create a feature (called a trap) into which oil can migrate and be stored for 10s and even 100s of millions of years. There are many different types of traps in which hydrocarbons can accumulate. One of the most common is the anticline. An anticline resembles a hill or an inverted bowl. Oil or gas will migrate upward through porous rocks and become trapped at the crest of the anticline (Figure 1a).
The oil industry aims to find hydrocarbons trapped in the subsurface that can be produced at a profit. To do this, the oil and gas industry collects and analyses vast quantities of subsurface geologic and geophysical data. These data are divided into two broad categories: well data and seismic data.[1]
Well data is information collected from the well bore, that is the hole in the ground created by the drilling process. The data may be collected while the well is drilling or shortly thereafter. Data typically collected and used by the geologist includes mud logs, well logs, and core.
Mud logs: When drilling a well, fluid is used to cool the bit and carry rock fragments created by the drilling process away from the bit and to the surface. This fluid is called “mud”. Modern mud logs record the lithology of the drilled rocks based on the rock fragments and the presence of oil and gas carried to the surface by the mud.
Well Logs: These are measurements of the rock properties inside the well bore. A few of the most common measurements used today include natural gamma radiation, resistivity, density, and neutron porosity. These measurements are made after the well has been drilled. Sophisticated tools are lowered to the bottom of the well. Rock property measurements are made as the tools are pulled out of the well.
Core: These are samples of the rock taken either during drilling. Whole-diameter cores are taken by replacing the drill bit with a special coring tool. The tool allows cylinders of rock to be retrieved from the subsurface.
Seismic data collected by the oil and gas industry uses sound waves to create an image of the subsurface, similar to how doctors use ultrasound to create images of a baby in a mother's womb. The process starts by sending vibrations through the earth. In the past, dynamite was used to generate vibrations and is still used in some places. Today, trucks that vibrate the ground are more common.
The sound waves travel through the earth and are reflected from rock layers and other places where the rock properties change. Sensitive listening devices called geophones onshore record these reflections. The reflections are used to create images of the rocks in the subsurface. One important thing to know about seismic data is that it records the time it takes for the sound waves to travel down through the earth and reflect back to the geophone. These times must be converted to depth to generate maps, cross sections, and drilling prognosis.
The data collected and used to analyze the field discussed here was extremely primate compared to modern data. At the time of discovery, all the data collected across the field, including well-log and seismic data, was based on analog technology. Geophysicists had to calculate by hand the time it took for each reflection to travel down and back and then convert that to depth.
When this case went to trial in the 1980s, technology had advanced significantly since the time of discovery but it was still primitive compared to what we see today. Well logs were printed on folding paper a foot wide and tens of feet long. Interpretation was typically done by hanging the logs on walls or laying them out on drafting tables so the sand layers and formation boundaries could be correlated from well to well using colored pencils.
[1] The purpose of this article is only to provide an example of some of the data types used by the oil and gas industry. The data types presented here have therefore been limited.
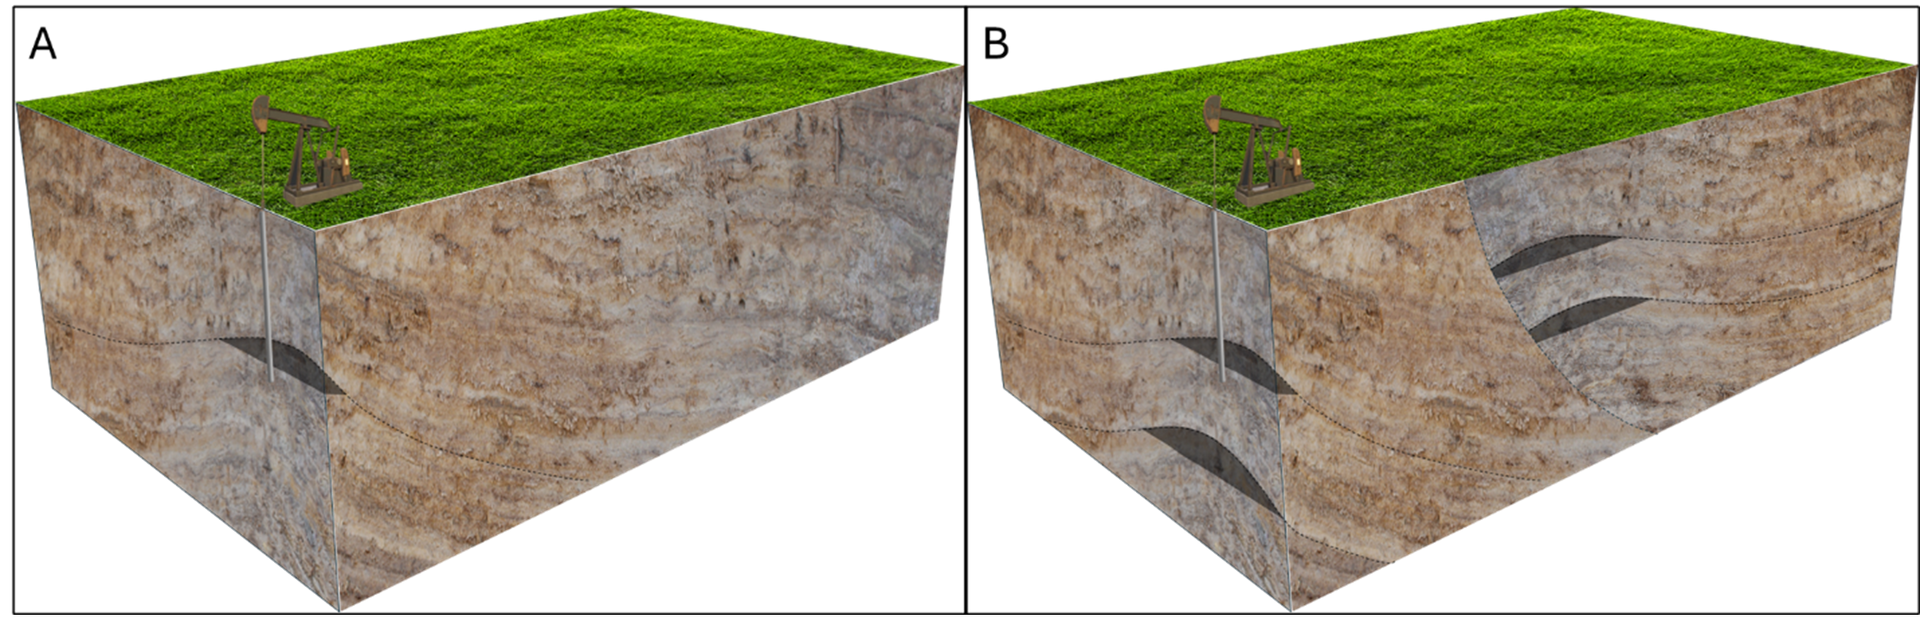
Figure 1: Conceptual block diagrams of the subsurface geology. Left, Figure 1A depicts the position of the Operator, which shows a single oil field produced from a single formation. Right, Figure 1B depicts the position of the Lessor, which shows multiple potential oil fields and multiple potential productive formations. (The Image of the Pump Jack is licensed under CC BY-NC and has been modified from the original form.)
Seismic data back then was generally printed on paper sections up to three feet wide and tens of feet long.As with well logs, the data were interpreted using colored pencils.Converting the seismic data from time to depth was still done by hand.Information from well logs and seismic data were integrated to create hand-drafted maps and cross-sections showing subsurface geologic structure and hydrocarbon distribution.
Based on analysis and interpretation that may have included the types of data described above, the geologist for the lessor concluded that the 8,900 acres outside the producing field contained multiple structures capable of trapping oil and gas. Further, the geologist for the lessor also concluded that below the Frio Formation was another formation, the Vicksburg Formation, that could have sandstone layers in which oil and gas had been trapped.
The two viewpoints on which this case was based are illustrated in Figures 1A and 1B. Both figures are block diagrams showing two possibilities for the subsurface. Figure 1a depicts the Operator's position, in which an oil field is found at the crest of an anticline producing from a single layer. The oil field is shown in black. Also shown in the diagram is a borehole penetrating the field. A pump jack is positioned just above the field.
Figure 1B shows the lessor's position. This block diagram shows two fields; the first oil field is at the crest of the anticline shown in Figure 1A. A second field to the right of the first one is in a faulted anticline. This represents additional potential fields in the lessor's property. Also shown in Figure 1b are two reservoir horizons. The shallow horizon represents potential production from the Frio Formation, while the deeper horizon represents potential production from the Vicksburg Formation.
Results
The courts ultimately sided with the lessor, concluding that the operator had not done enough to fully explore and develop the oil and gas potential of the 8,900 acres outside the field under production or test the potential for production in the deeper Vicksburg Formation. The case shows how two different geologists can look at the same data and come to two very different conclusions.
The technology employed by the oil and gas industry has advanced dramatically since this case went to trial. Today, your typical geologist, geophysicist, or earth scientist sits in front of multiple computer monitors analyzing, visualizing, and interpreting data using sophisticated software on high-end laptops or workstations.
Well-log data can now be acquired while drilling or by traditional wireline methods. The variety of well-logging tools available and the accuracy and resolution of data have increased dramatically. Today, logging technology can resolve rock layers a fraction of an inch thick and identify the presence of hydrocarbons in places never thought possible in the 1980s.
Technologies for acquiring, processing, and imaging seismic data have also advanced orders of magnitude. When this case went to trial, 2D seismic data interpreted on paper sections was the standard. Today, the standard is 3D seismic data interpreted on laptop computers, and seismic images of the subsurface look like cross sections of Earth.
Despite these advancements, no two professionals will interpret the data exactly the same, and differences of opinion will always exist. Ideas about the potential of a technique, a technology, or a location to produce oil and gas will frequently differ from one professional to another. What is obvious today was not necessarily obvious 50, 20, or even 10 years ago. The development of unconventional resources is a great example. Fifty years ago, no one thought about drilling horizontally into impermeable shales and then fracking them for oil and gas production. Twenty years ago, the idea was considered experimental; today, it is a proven technology.