
A.J. Davidoff LLC
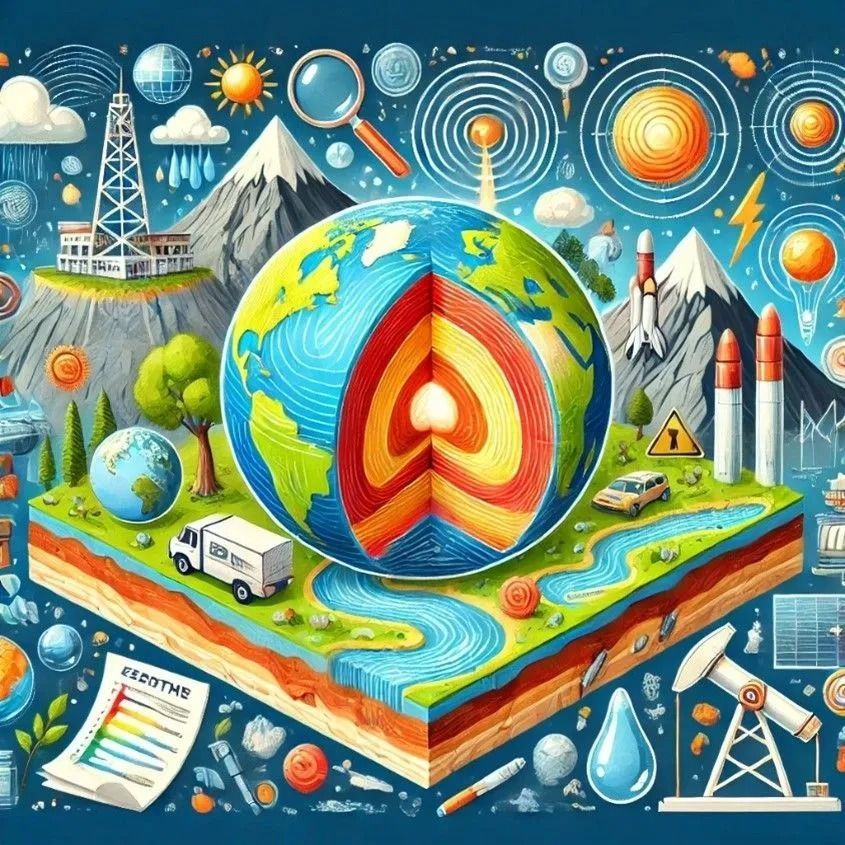
Geologic Insights & Perspectives
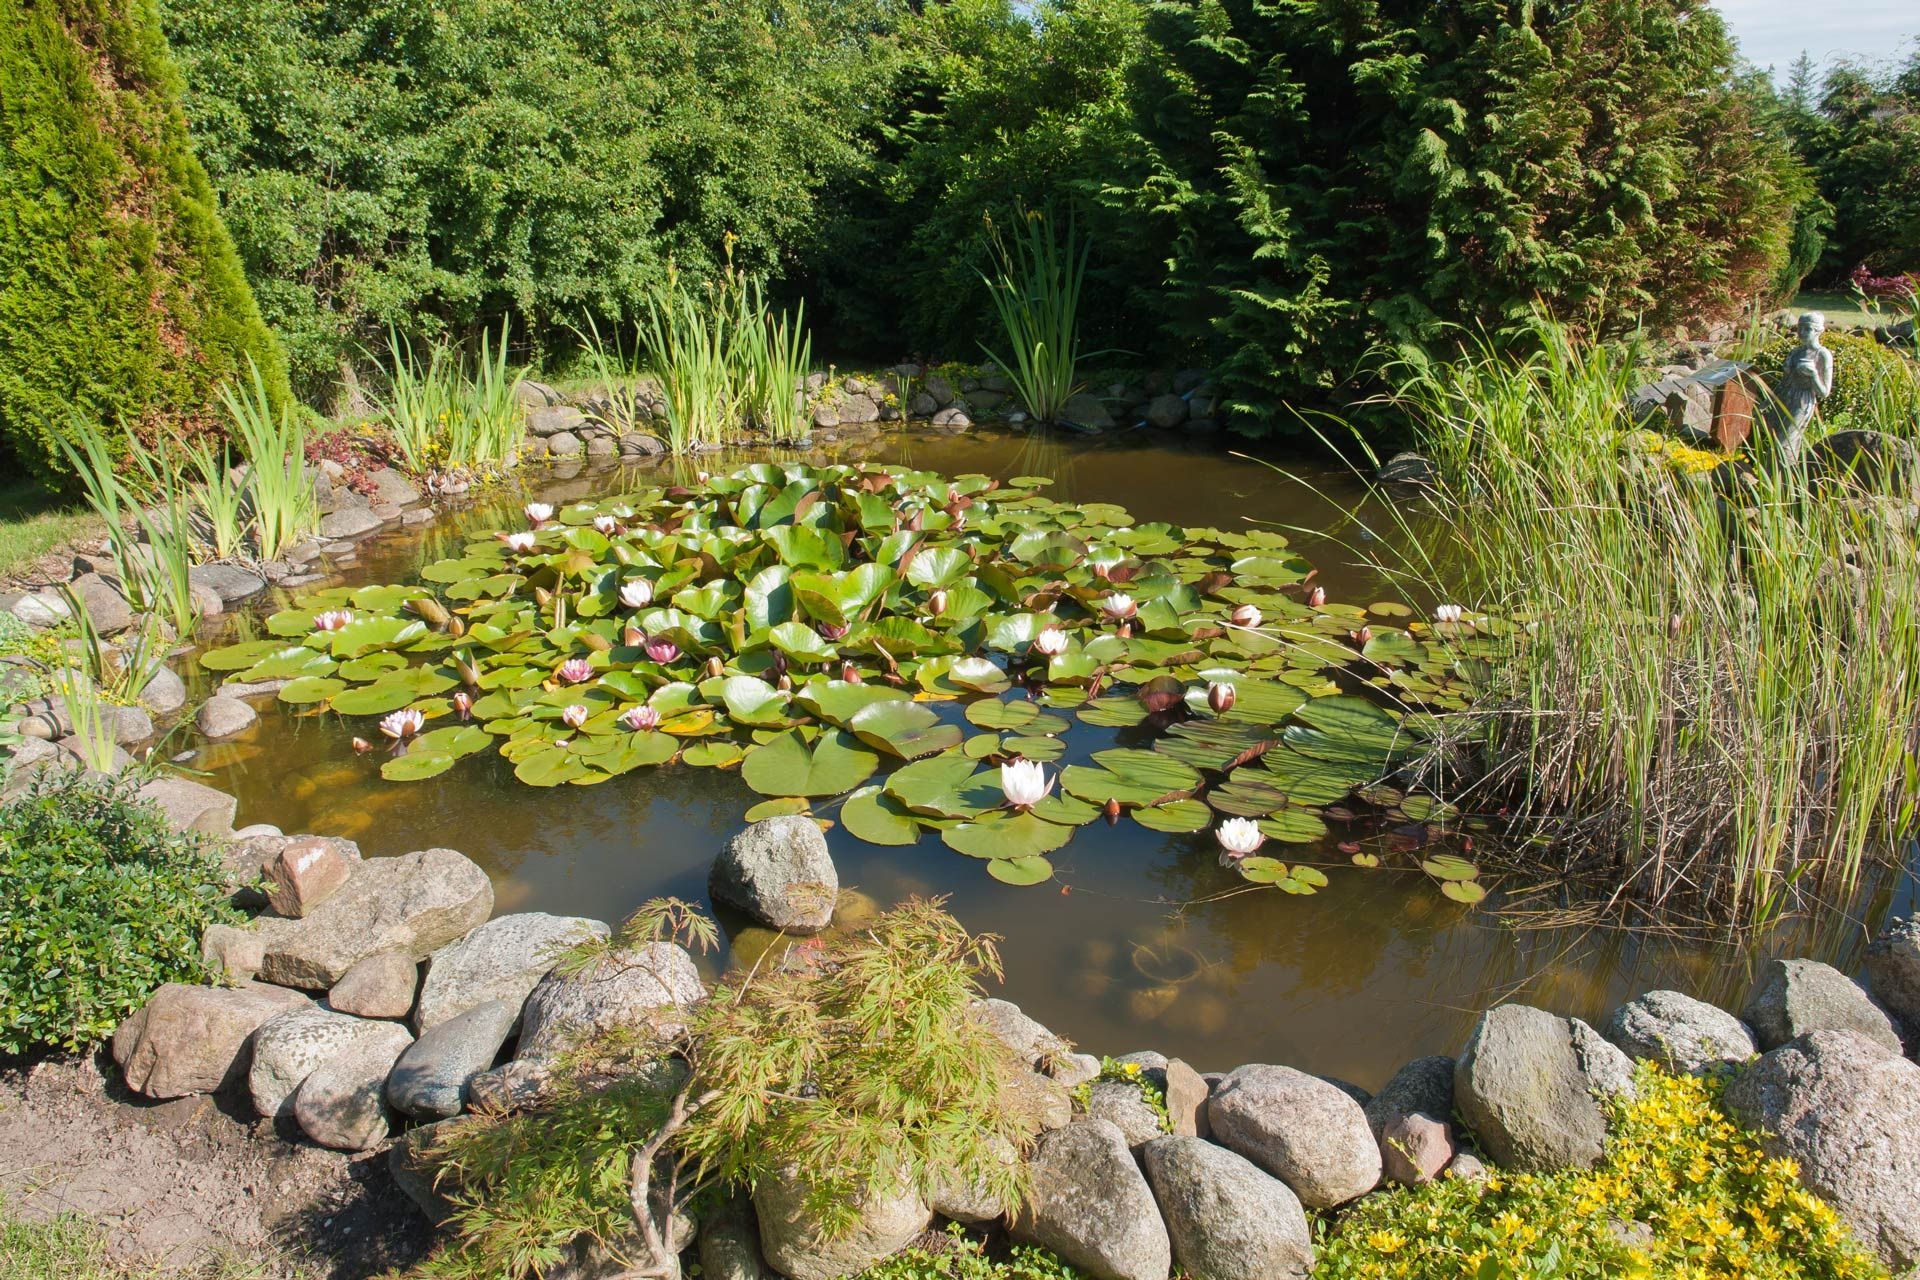
Case Summary: The incident in question involves the drowning death of an older adult found in a pond behind the family residence.
Based in Houston, TX, A. J. Davidoff LLC provides expert geological advice for the energy industry and legal consulting. Call (281) 771-8916 today!
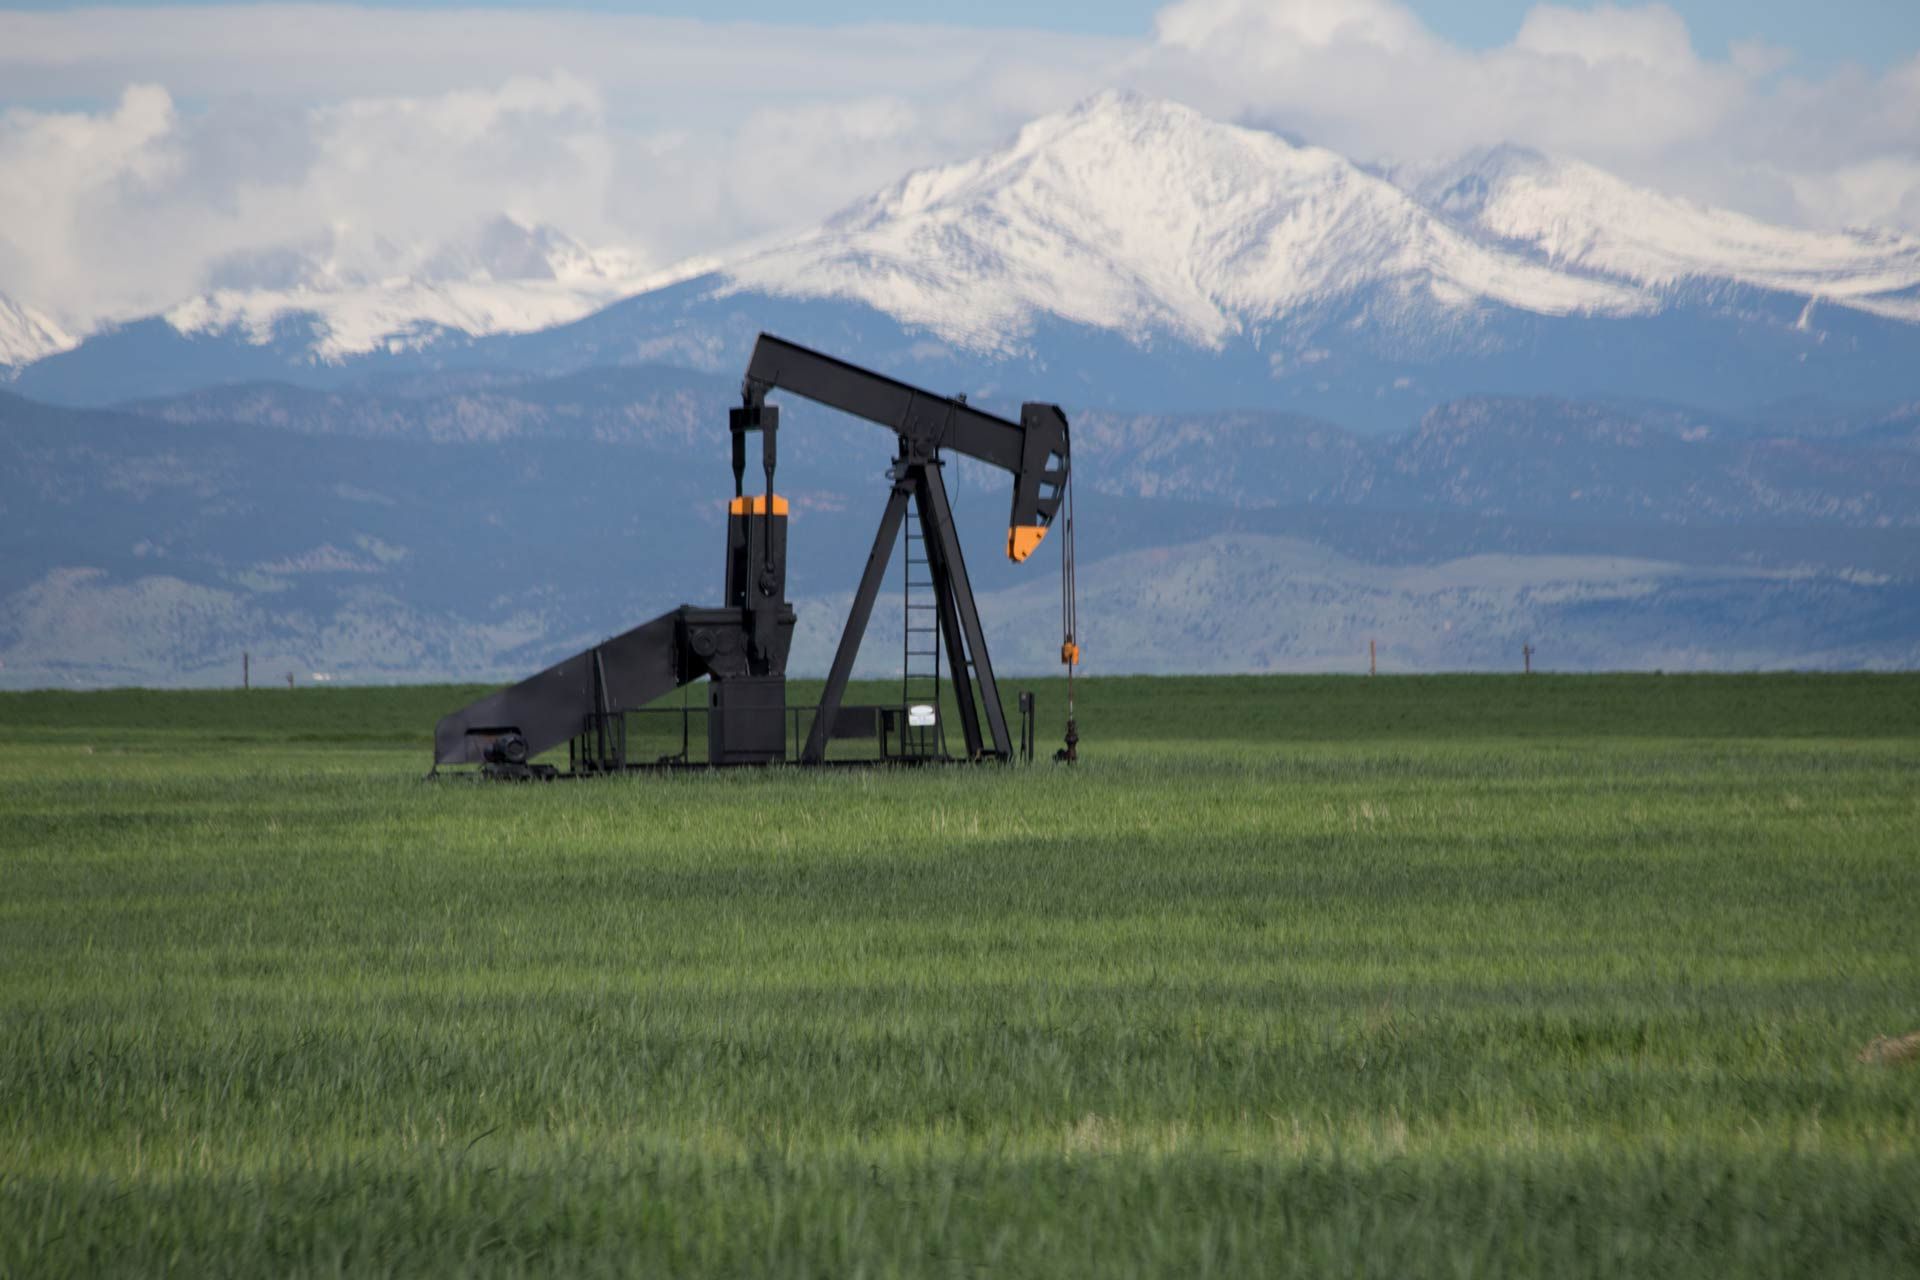
Based in Houston, TX, A. J. Davidoff LLC provides expert geological advice for the energy industry and legal consulting. Call (281) 771-8916 today!